Obtaining diagnostic logs when firewall is freezing
Description
Technical Support require console logs to be provided for analysis when the device isn't responding via GUI or through any LAN/WAN interfaces.
Unfortunately after rebooting the firewall, most of the required data will be lost and Tech Support will be unable to provide root cause analysis or resolution.
Console logs are important in the following cases:
- If the firewall is freezing and GUI is inaccessible, console logs before the reboot will show us what process is causing the failure.
 NOTE: If the SSH is also not working, the only option is to connect via a console cable
 - If the firewall randomly reboots, it's always recommended to have a console cable connected and actively logging so that we can catch the error causing the reboot.
When the firewall locks up or becomes unresponsive there is some data that can help our Tech Support find the probable root cause of the reported issue.
This article will use Putty client to gather key information over SSH connection.
For information on how to connect via console cable: How to export SonicWall UTM console logs to a file
- Log in to SonicWALL Firewall via Putty or another terminal emulator program.
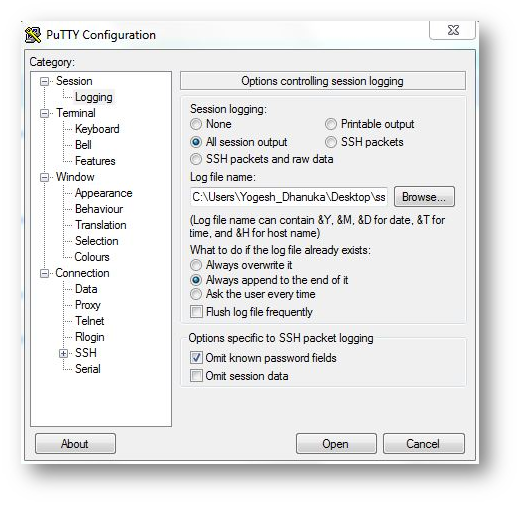
- To save the console output to a file browse to Session | logging.
- Select option All session output under Session logging and locate a path for file to be saved as .txt.
- Select the radio button Always append to the end of it and ensure Flush log file frequently box is unchecked.
- Click on the session from the left hand side and type the IP address of the SonicWall under Host name and ensure SSH is selected under "Connection Type"
- Click on the Open to connect to the appliance via SSH and wait for username prompt, enter username/password and wait for the command line prompt to appear.
NOTE: SSH must be enabled on the interface you're connecting to.
Resolution for SonicOS 7.X
This release includes significant user interface changes and many new features that are different from the SonicOS 6.5 and earlier firmware. The below resolution is for customers using SonicOS 7.X firmware.
To export Tech Support Report type the following:
- no cli pager session
- show tech-support
After running the above, please run the following commands:
- diag show CPU
- diag show processes
- diag show process process_name NOTE: replace process_name with the name of the process that is overloading the CPU( i.e. stacktrace zNSM) based on the output of diag show CPU
Please run this command for 8 to 10 times as it will give different outputs.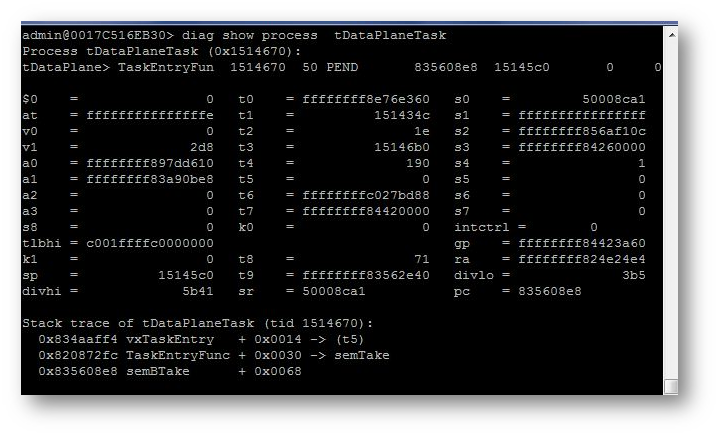
- diag show multicore
- diag show process DP-engine-0
- diag show process DP-engine-1
- diag show process DP-engine-2
- diag show process DP-engine-3
- show interfaces status
- show interfaces statistics (Run the same command after 10-15 seconds again)
- show switch-statdump (Run the same command after 10-15 seconds again)
- show status
- diag show mem-pools
- diag show memory
- diag show pktio-nic
- diag show web-server
- diag show timer-counters
- diag show pktio-throughput-stop
- diag show drop-stats
- diag show pp-stats
- diag show wd-stats
- diag show ipnet sockets
- diag show ipnet statistic
- diag show ipnet TCP-statistic
- diag gen-coredump (run this command last as executing the command will restart the firewall and generate new coredump. Download coredump after reboot)
To export the Tracelogs and console logs, they can only be obtained via API, FTP or SCP but they can't be generated via CLI.
- export trace-log <WORD> { api | FTP <FTP_URL> | scp <SCP_URL> [ port <IPV4_PORT> ] }
 EXAMPLE: export trace-log &traceLogType=1 scp user@server:/home/user/tracelog.wri
 - export console-logs { api | FTP <FTP_URL> | scp <SCP_URL> [ port <IPV4_PORT> ] } EXAMPLE: export console-logs scp user@server:/home/user/consolelogs.wri
Attach the file which was saved for saving the console output to the support case for analysis.
Resolution for SonicOS 6.5
This release includes significant user interface changes and many new features that are different from the SonicOS 6.2 and earlier firmware. The below resolution is for customers using SonicOS 6.5 firmware.
To export Tech Support Report type the following:
- no cli pager session
- show tech-support
After running the above, please run the following commands:
- diag show tracelog current
- diag show tracelog last
- diag show CPU
- diag show process process_name NOTE: replace process_name with the name of the process that is overloading the CPU( i.e. stacktrace zNSM) based on the output of diag show CPU
Please run this command for 8 to 10 times as it will give different outputs. - diag show mem-pools
- diag show cp-stats
- diag show memory
- diag show memzone
- diag show wd-stats
- diag show fpa
- show log view