How can I setup and utilize the Packet Monitor feature for troubleshooting?
Description
The Packet Monitor Feature on the SonicWall is one of the most powerful and useful tools for troubleshooting a wide variety of issues. Any Packets which pass through the SonicWall can be viewed, examined, and even exported to tools like Wireshark.
This article will detail how to setup a Packet Monitor, the various common use options, and how to read the out from a successful Packet Monitor.
Resolution for SonicOS 7.X
This release includes significant user interface changes and many new features that are different from the SonicOS 6.5 and earlier firmware. The below resolution is for customers using SonicOS 7.X firmware.
Setting Up a Packet Monitor
- Login to the SonicWall Management GUI and navigate to Monitor | Tools & Monitors | Packet Monitor.
- Ensure that the Packet Monitor is in Trace Off Status, then click Reload. If there are any Packets in the Captured Packets Field, click Clear to remove them.

 TIP: When performing a new Packet Monitor it's recommended to click the Monitor Default button, this will restore the Packet Monitor to a default state and prevent accidental misconfiguration.
- Navigate to the General tab and set up the below tabs as necessary.
- Click Save and then click Start Capture on the Captures Packets tab.

Settings
- On the Settings Tab, you can configure the following.
- The Number of Bytes to Capture per Packet.
- Whether the Packet Monitor will stop capturing or overwrite Packets once the Buffer is full.
- What traffic to Exclude such as GMS, Syslogs, and SonicPoint Management.
- Normally the default options for the Settings tab are correct for most Packet Monitors although if what you're looking to capture is being obfuscated by things like Management Traffic, the Settings tab is the place to resolve that.

Monitor Filter
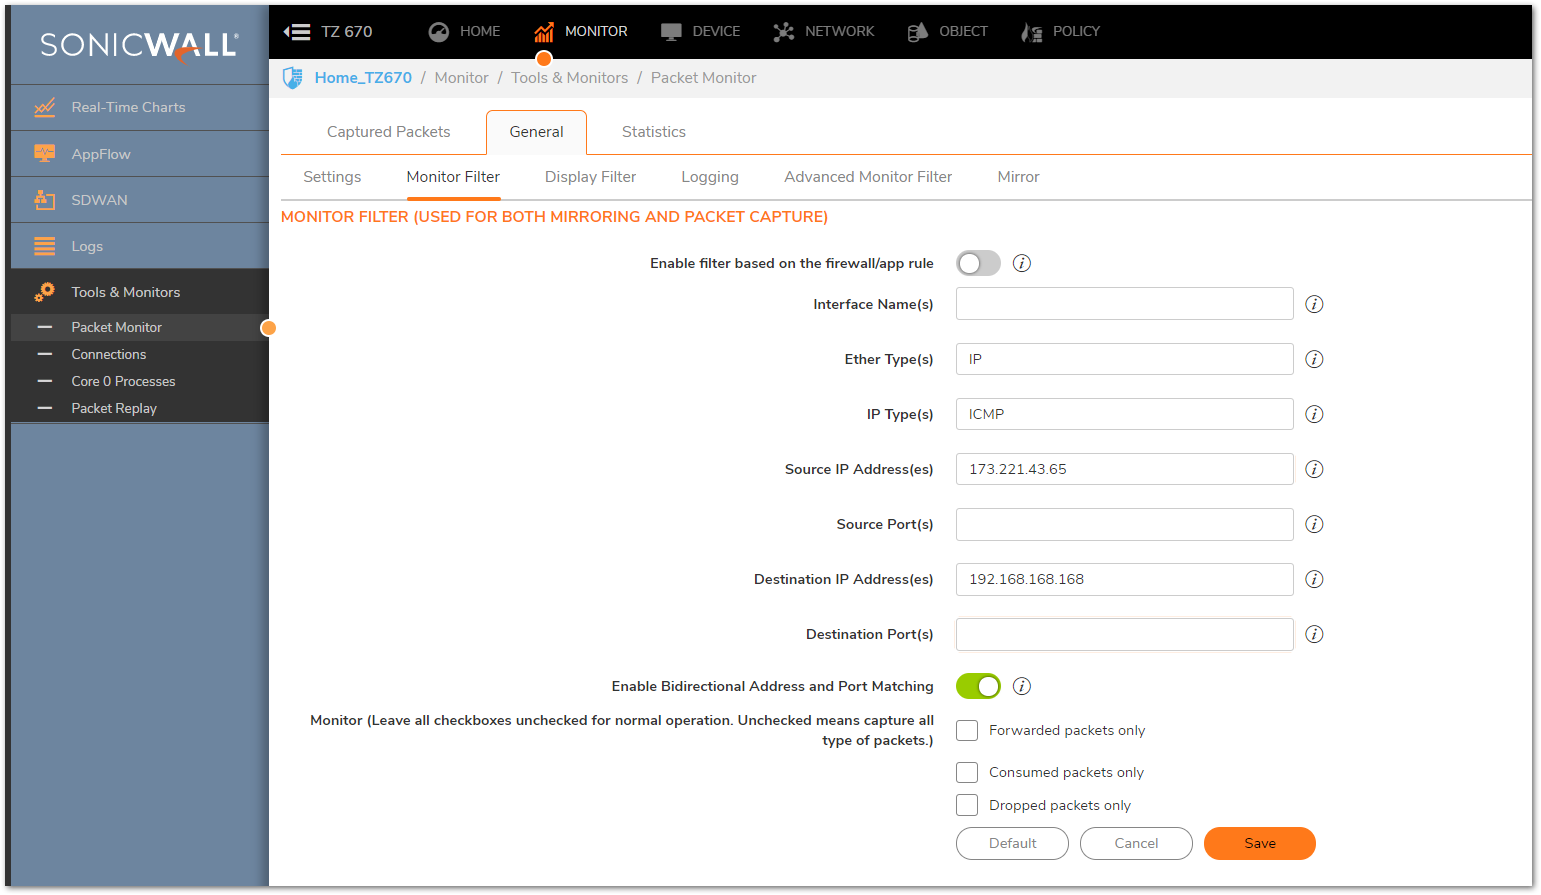
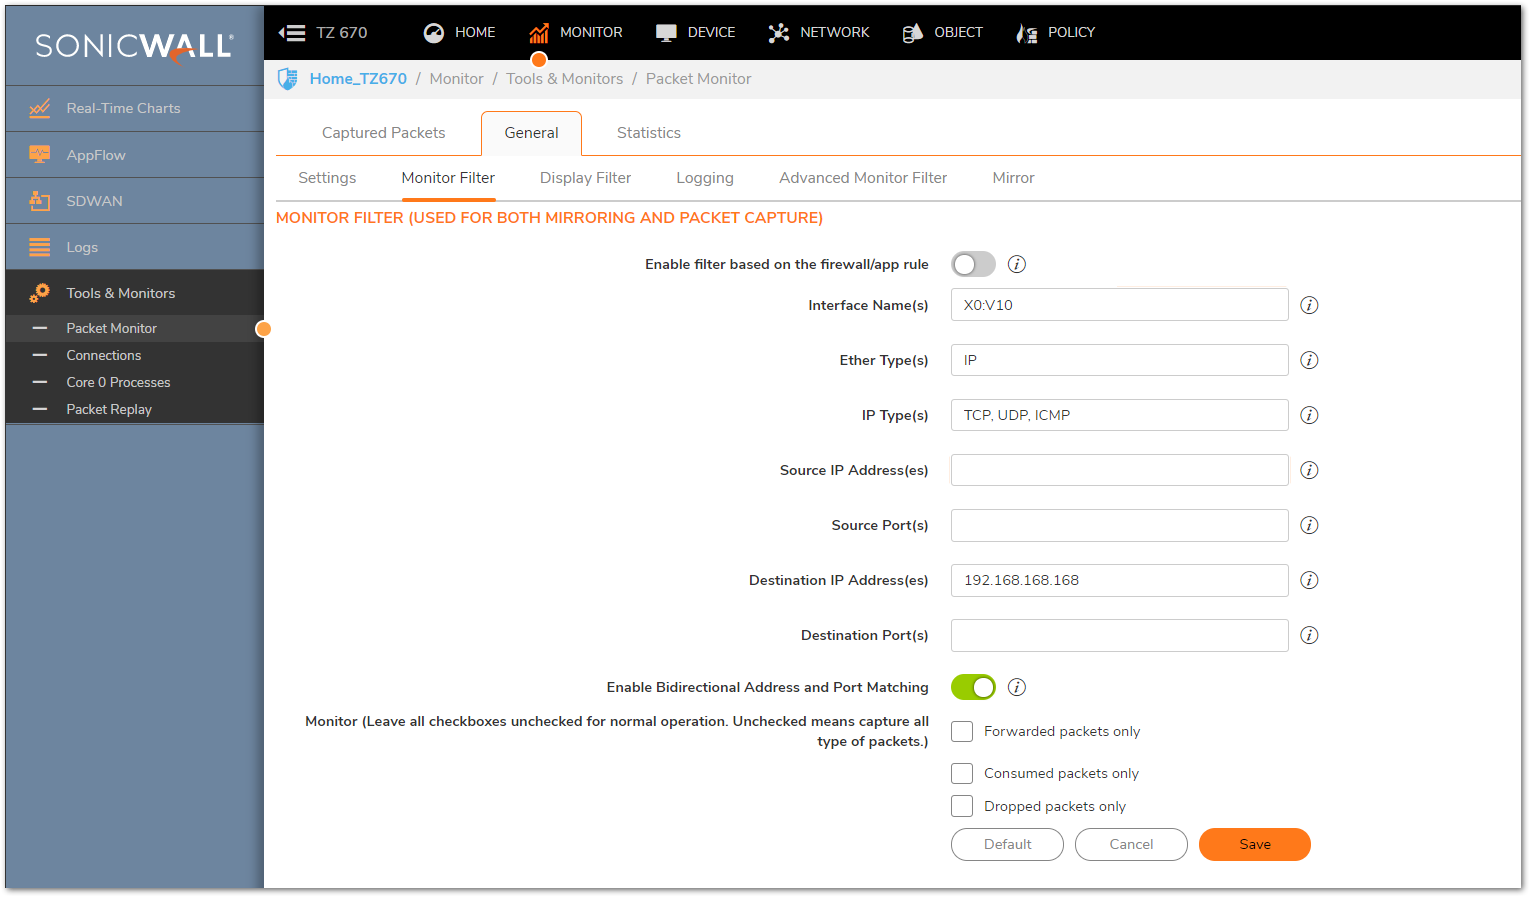
- This is where the bulk of the Packet Monitor configuration is done. The Monitor Filter will allow you to set Source and Destination IP Addresses and ports, and specify the capture Interface and Protocol. All of these Fields will impact the captured packets and can give a different perspective on the traffic flow depending on how they're set up.
- You can hover over the small triangular arrows to the right of each Field to get examples of possible input, this can help greatly in determining what to put into each Field.
 NOTE: Regarding the checkboxes for Forwarded/Consumed/Dropped Packets on the Monitor Filter, these will force the Packet Monitor to collect only traffic that matches those options. By default these are unchecked, meaning the SonicWall will capture all traffic regardless of Status. This is recommended for most captures. The Monitor Filter impacts only the Captured Packets, so anything configured here will be collected via the Packet Monitor. It is possible to configure the Display Filter to narrow down what is shown on the Packet Monitor Tool, which will be detailed below.
 TIP: For most Packet Monitor Configurations Ether Type, IP Type, and some combination of Source/Destination IP Address/Port are all that is required. It's recommended to keep the Capture as open as possible without including undesired traffic so as to avoid missing any packets that may contribute to troubleshooting an issue. In some situations, it's helpful to see the Ingress/Egress NAT Policies that are being applied to packets. To do so, capture by ONLY the Source IP to see the Ingress NATs or capture ONLY by the Destination IP to see Egress NATs.
 EXAMPLE: Monitor Filter Setups
- Capturing HTTPS Traffic from an Internal Host to Any External IP address.

- Capturing ICMP Traffic from an External Host to an Internal Server
- Capturing VLAN Traffic from an Internal Host
Display Filter
- When you're capturing more traffic than you want to see but can't narrow the capture down appropriately using the Monitor Filter, the Display Filter can help with focusing on a particular stream. The Display Filter has all the same Fields and options as the Monitor Filter, however these only impact the traffic that is shown by the Packet Monitor, not what is captured by the tool.
 NOTE: For most captures it is advised to leave the Display Filter in a default state initially. If you have trouble interpreting the initial Monitor Filter results then the Display Filter can be of use. Configuring the Display Filter incorrectly can negatively impact the usefulness of the Packet Monitor tool.
Logging
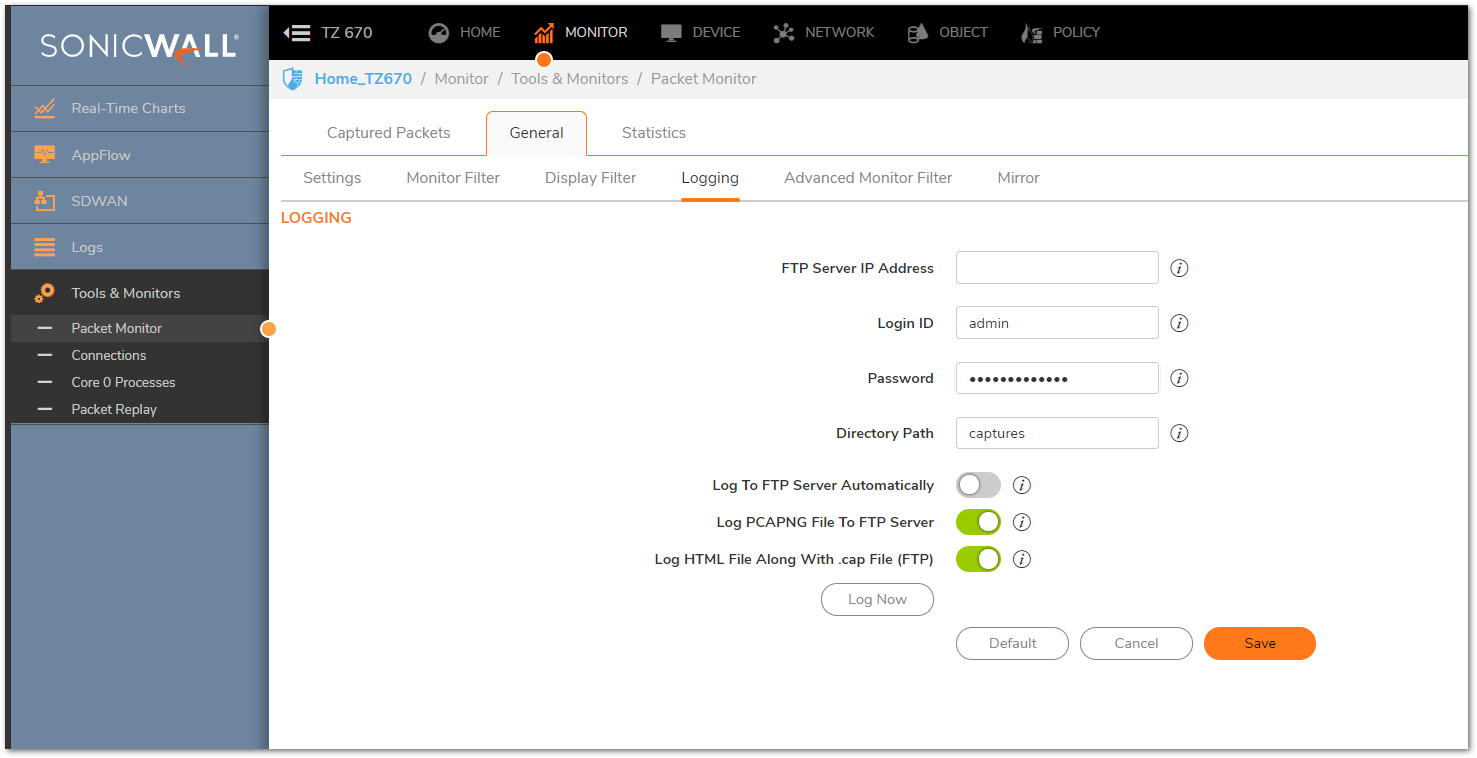
- The Logging tab is used for sending Packet Monitor results to an FTP Server, typically this is done when more traffic needs to be captured than the SonicWall's Buffer Memory can hold or preserve the Packet Monitor results.
Advanced Monitoring Filter
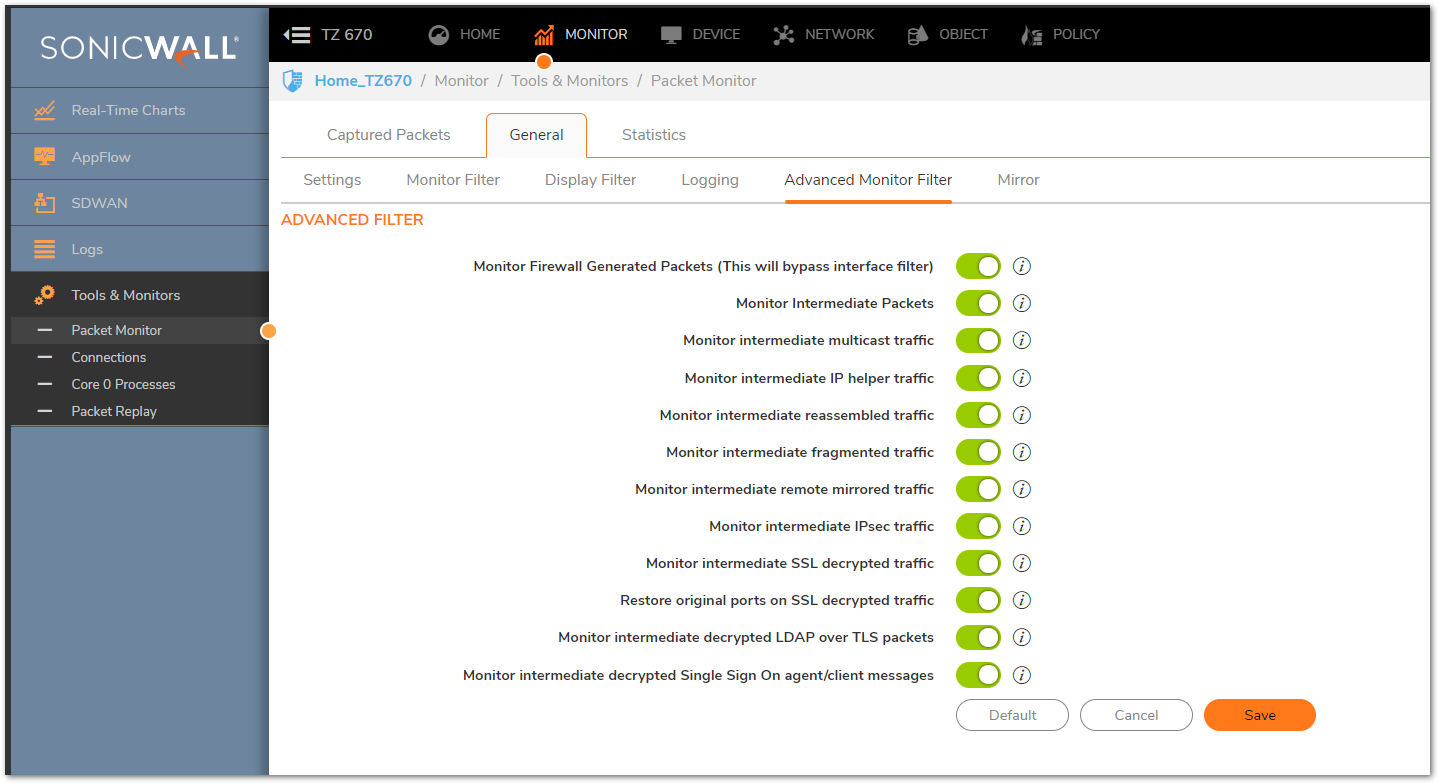
- The Advanced Monitor Filter allows specific traffic to be captured which the SonicWall would ordinarily not collect. This includes many intermediate hops for particular protocols, such as Multicast and IPSec, as well as packets Generated by the SonicWall itself.
- It is generally advisable to enable all the options on the Advanced Monitor Filter tab to be sure that nothing is missing from a particular traffic flow. In the event that some traffic relating to an Advanced Monitor Filter option is making it difficult to interpret the capture, it can be disabled.
- You can hover over the small triangular arrows to the right of each Checkbox for more information, this can help greatly with understanding how each option impacts the Packet Monitor.
Mirror
- Mirroring is appropriate when the traffic from a Packet Monitor needs to be sent to another SonicWall, either via direct connection or via IPSec VPN. Setting this feature up is outside the scope of this article but for more information please reference the SonicWall Help Menu or Overview and Configuration of Packet Mirror.
Captured Packets, Packet Details, and Hex Dump
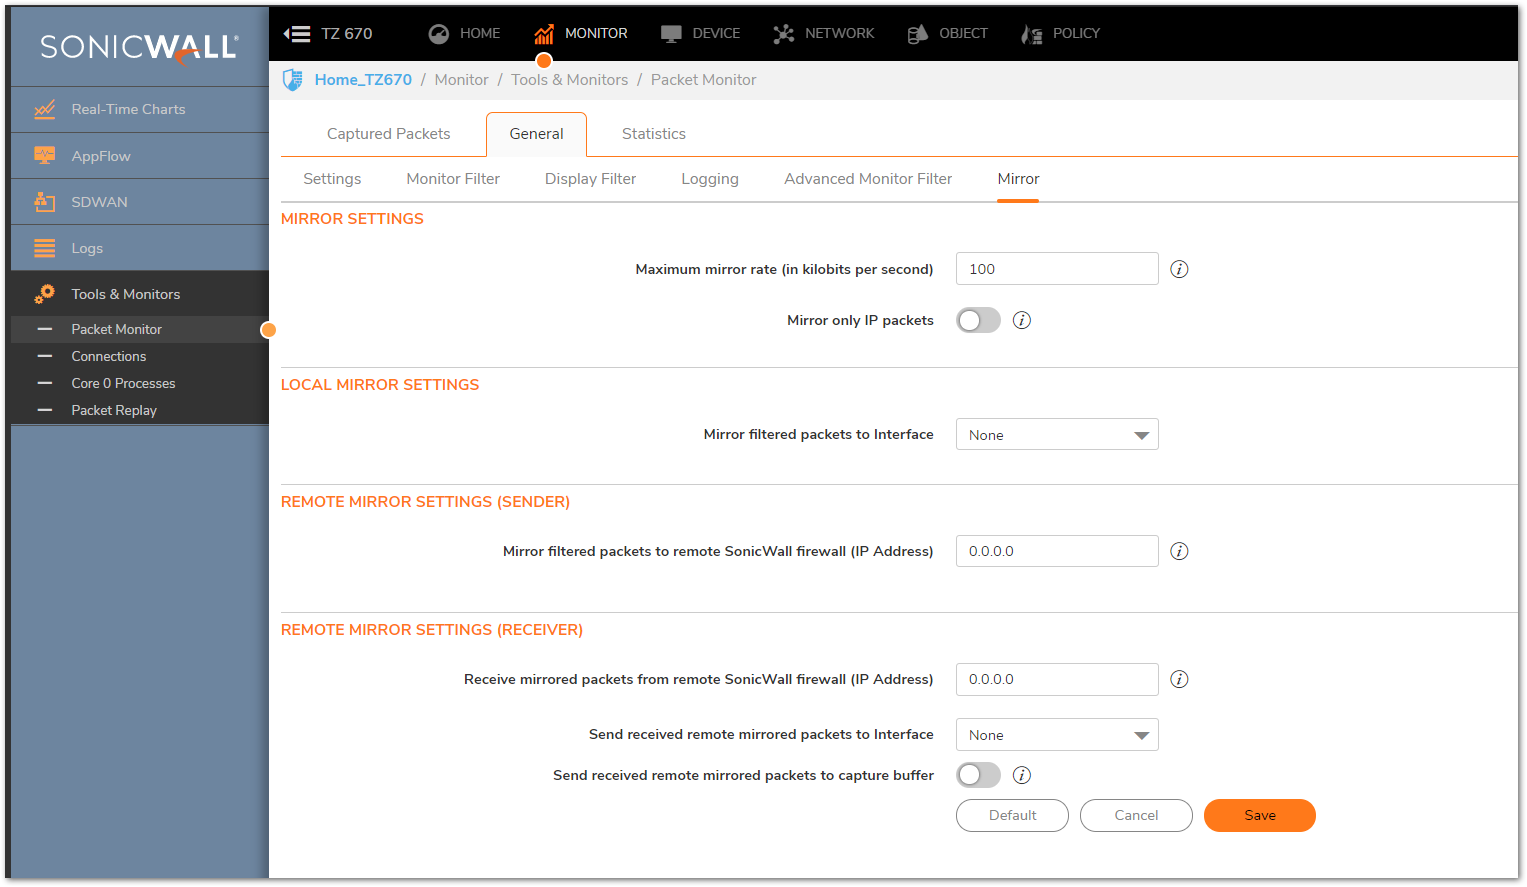
- Once the Packet Monitor is configured and the Trace is On you will see the Captured Packets field begin to populate. This will contain every packet that passes through the SonicWall which also meets the criteria set in the Monitor Filter, as well as the Display Filter. If the Display Filter is unconfigured then packets will display based on the Monitor Filter configuration.
- Packets are captured based on the order they arrive at the SonicWall and/or the order they have settings applied to them. For example, if you have traffic enter the SonicWall that is then subject to Network Address Translation you will see the traffic come in, be subjected to the NAT, and finally sent on its way.
- If you click on a particular packet you can view the Packet Details and the Hex Dump.
 TIP: Packets that are displayed in Red are being dropped by the SonicWall, look at the Packet Details to find out why
 - Packet Details
This field will show the Source/Destination IP Address, MAC Address, and Port, the TCP Flag (if appropriate), as well as additional values such as the Drop Code/Reason if the Packet has been dropped by the SonicWall. - Hex Dump
This field will show the Packet Payload, assuming the traffic is unencrypted. Encrypted traffic will still be displayed here but the SonicWall will be unable to display the payload. TIP: Examining the Hex Dump for troubleshooting issues relating to LDAP, FTP, and other unencrypted traffic flows can be an excellent way to spot configuration and user errors.
Exporting Packet Monitor Results
At times it's useful to export the results of a Packet Monitor for examination in another format or via another program. This can be accomplished through the Export As an option on the Packet Monitor page. Options include.
- Libpcap (Wireshark)
- Text (.wri)
- HTML
- App Data
- PcapNG (Firmware Versions 6.2.7.1 and Above)
Different Supported Packet Types on SonicOS are:
When specifying the Ethernet or IP packet types that you want to monitor or display, you can use either the standard acronym for the type if supported or the corresponding hexadecimal representation. The protocol acronyms that SonicOS currently supports are mentioned below:
| Supported Types | Protocol Acronyms |
| Supported Ethernet Types | ARP, IP, PPPoE-DIS, PPPoE-SES |
| Supported IP Types | TCP, UDP, ICMP, IGMP, GRE, AH, ES P |
 NOTE: When there is a need to specify both PPPoE-DIS and PPPoE-SES, you can simply use PPPoE.
Details on IP address and Port Information while configuring the packet capture
Source IP / Destination IP Address
- Specify the IP address (or addresses separated by commas) on which packet capture needs to be performed. A maximum of 10 IP addresses can be listed. Negative IP addresses are also supported like !1.1.1.1,!2.2.2.2/24 which is generally to exclude the traffic from that specified IP address. We can also include 1.1.1.0/24 syntax but it might not give the desired output.
Source Port/ Destination Port List
- Specify the Port Address (or addresses separated by commas) on which packet capture needs to be performed. A maximum of 10 UDP/TCP port numbers can be listed. Negative port numbers can also be specified like !80, !90, etc. which is generally to exclude the traffic for those ports.
Resolution for SonicOS 6.5
This release includes significant user interface changes and many new features that are different from the SonicOS 6.2 and earlier firmware. The below resolution is for customers using SonicOS 6.5 firmware.
Setting Up a Packet Monitor
- Login to the SonicWall Management GUI and navigate to Investigate | Packet Monitor.
- Ensure that the Packet Monitor is in Trace Off Status, then click Refresh. If there are any Packets in the Captured Packets Field, click Clear to remove them.
 TIP: When performing a new Packet Monitor it's recommended to click the Monitor Default button, this will restore the Packet Monitor to a default state and prevent accidental misconfiguration.
 - Click Configure (at the bottom of the page)and set up the below tabs as necessary.
- Click OK and then click Start Capture.
Settings
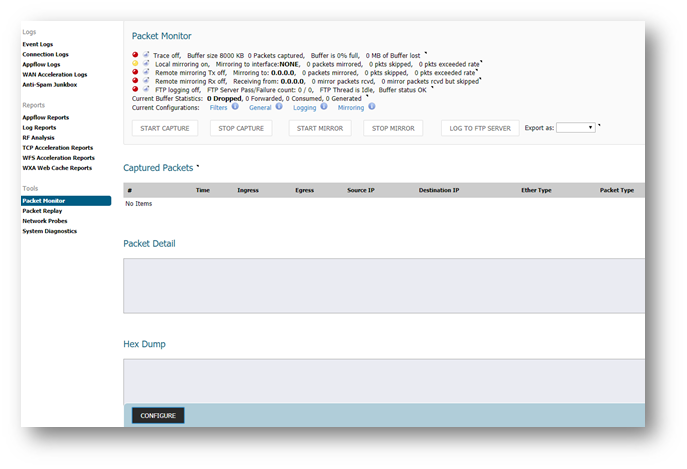
- On the Settings Tab, you can configure the following.
- The Number of Bytes to Capture per Packet.
- Whether the Packet Monitor will stop capturing or overwrite Packets once the Buffer is full.
- What traffic to Exclude such as GMS, Syslogs, and SonicPoint Management.
- Normally the default options for the Settings tab are correct for most Packet Monitors although if what you're looking to capture is being obfuscated by things like Management Traffic, the Settings tab is the place to resolve that.
Monitor Filter
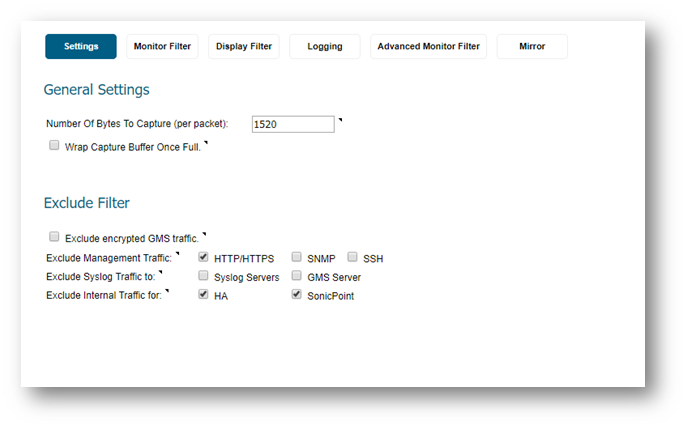
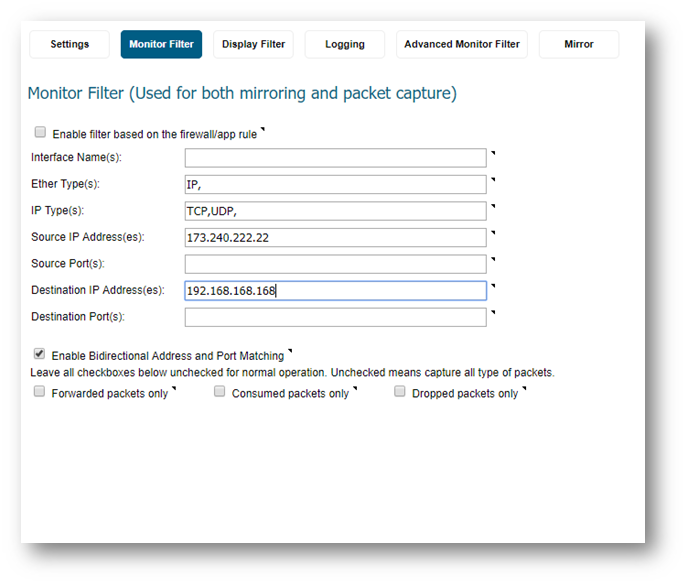
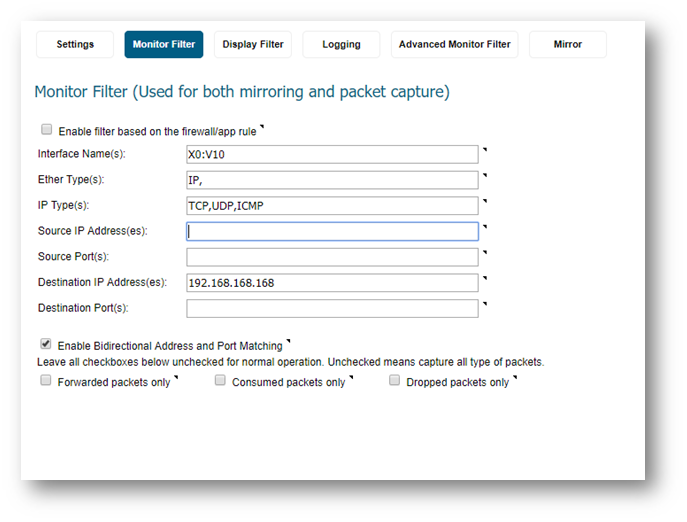
- This is where the bulk of the Packet Monitor configuration is done. The Monitor Filter will allow you to set Source and Destination IP Addresses and ports, and specify the capture Interface and Protocol. All of these Fields will impact the captured packets and can give a different perspective on the traffic flow depending on how they're set up.
- You can mouse over the small triangular arrows to the right of each Field to get examples of possible input, this can help greatly in determining what to put into each Field.
 NOTE: Regarding the checkboxes for Forwarded/Consumed/Dropped Packets on the Monitor Filter, these will force the Packet Monitor to collect only traffic that matches those options. By default these are unchecked, meaning the SonicWall will capture all traffic regardless of Status. This is recommended for most captures. The Monitor Filter impacts only the Captured Packets, so anything configured here will be collected via the Packet Monitor. It is possible to configure the Display Filter to narrow down what is shown on the Packet Monitor Tool, which will be detailed below.
 TIP: For most Packet Monitor Configurations Ether Type, IP Type, and some combination of Source/Destination IP Address/Port are all that is required. It's recommended to keep the Capture as open as possible without including undesired traffic so as to avoid missing any packets that may contribute to troubleshooting an issue. In some situations, it's helpful to see the Ingress/Egress NAT Policies that are being applied to packets. To do so, capture by ONLY the Source IP to see the Ingress NATs or capture ONLY by the Destination IP to see Egress NATs.
 EXAMPLE: Monitor Filter Setups
- Capturing HTTPS Traffic from an Internal Host to Any External IP address.
- Capturing ICMP Traffic from an External Host to an Internal Server
- Capturing VLAN Traffic from an Internal Host
Display Filter
- When you're capturing more traffic than you want to see but can't narrow the capture down appropriately using the Monitor Filter, the Display Filter can help with focusing on a particular stream. The Display Filter has all the same Fields and options as the Monitor Filter, however these only impact the traffic that is shown by the Packet Monitor, not what is captured by the tool.
 NOTE: For most captures it is advised to leave the Display Filter in a default state initially. If you have trouble interpreting the initial Monitor Filter results then the Display Filter can be of use. Configuring the Display Filter incorrectly can negatively impact the usefulness of the Packet Monitor tool.
Logging
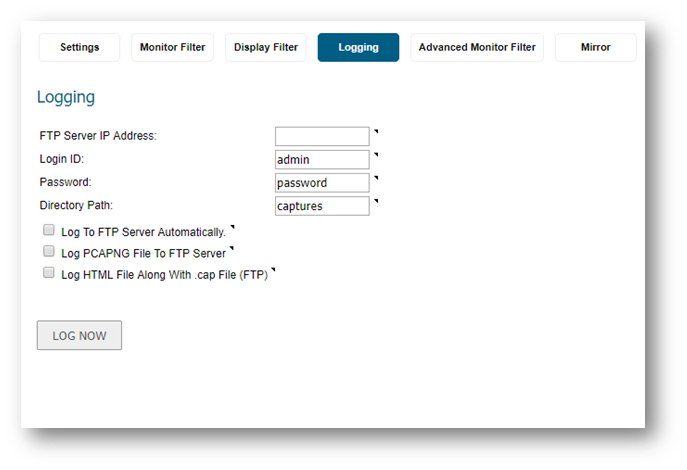
- The Logging tab is used for sending Packet Monitor results to an FTP Server, typically this is done when more traffic needs to be captured than the SonicWall's Buffer Memory can hold or preserve the Packet Monitor results.
Advanced Monitoring Filter
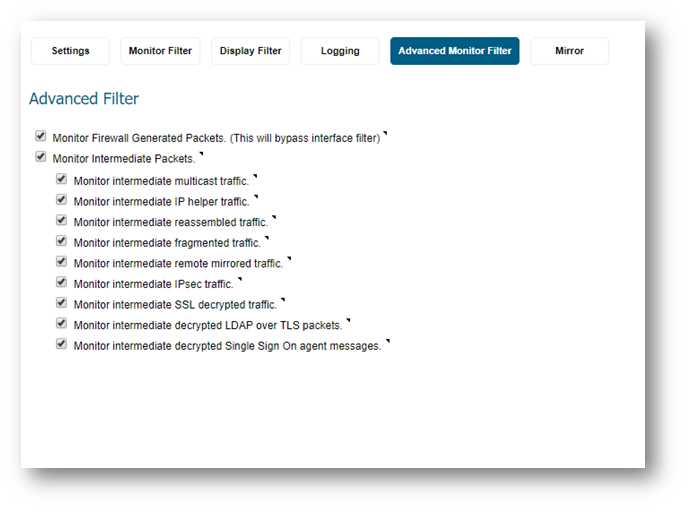
- The Advanced Monitor Filter allows specific traffic to be captured which the SonicWall would ordinarily not collect. This includes many intermediate hops for particular protocols, such as Multicast and IPSec, as well as packets Generated by the SonicWall itself.
- It is generally advisable to enable all the options on the Advanced Monitor Filter tab to be sure that nothing is missing from a particular traffic flow. In the event that some traffic relating to an Advanced Monitor Filter option is making it difficult to interpret the capture, it can be disabled.
- You can mouse over the small triangular arrows to the right of each Checkbox for more information, this can help greatly with understanding how each option impacts the Packet Monitor.
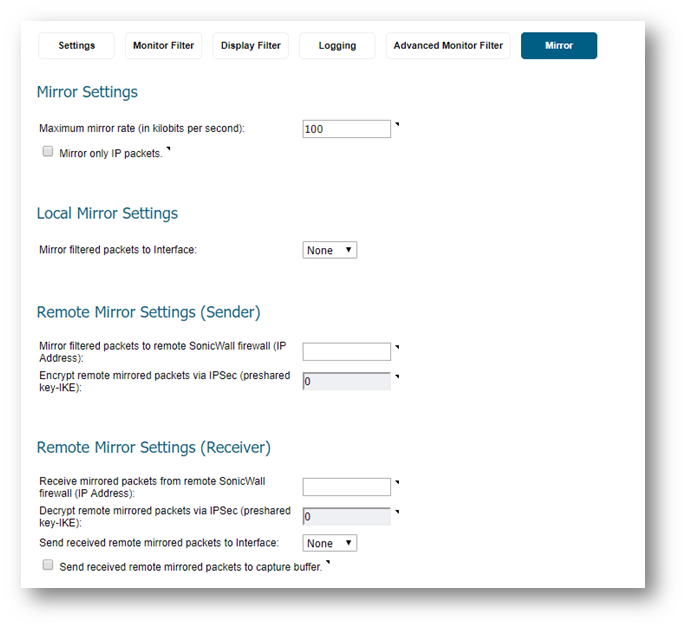
Mirror
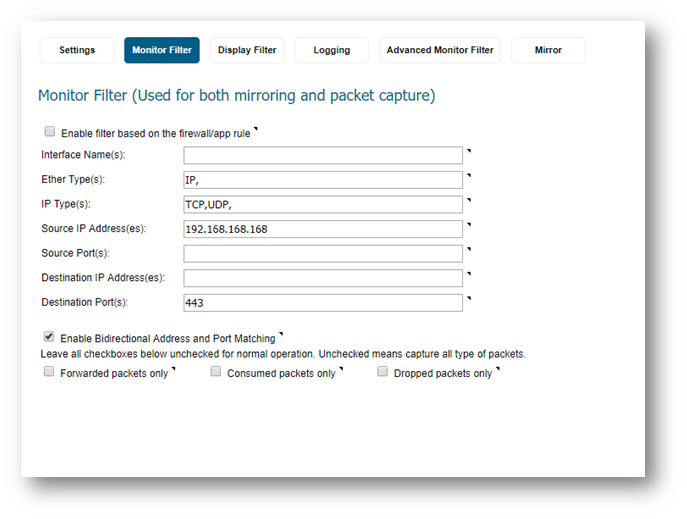
- Mirroring is appropriate when the traffic from a Packet Monitor needs to be sent to another SonicWall, either via direct connection or via IPSec VPN. Setting this feature up is outside the scope of this article but for more information please reference the SonicWall Help Menu or Overview and Configuration of Packet Mirror.
Captured Packets, Packet Details, and Hex Dump
- Once the Packet Monitor is configured and the Trace is On you will see the Captured Packets field begin to populate. This will contain every packet that passes through the SonicWall which also meets the criteria set in the Monitor Filter, as well as the Display Filter. If the Display Filter is unconfigured then packets will display based on the Monitor Filter configuration.
- Packets are captured based on the order they arrive at the SonicWall and/or the order they have settings applied to them. For example, if you have traffic enter the SonicWall that is then subject to Network Address Translation you will see the traffic come in, be subjected to the NAT, and finally sent on its way.
- If you click on a particular packet you can view the Packet Details and the Hex Dump.
 TIP: Packets that are displayed in Red are being dropped by the SonicWall, look at the Packet Details to find out why
 - Packet Details
This field will show the Source/Destination IP Address, MAC Address, and Port, the TCP Flag (if appropriate), as well as additional values such as the Drop Code/Reason if the Packet has been dropped by the SonicWall. - Hex Dump
This field will show the Packet Payload, assuming the traffic is unencrypted. Encrypted traffic will still be displayed here but the SonicWall will be unable to display the payload. TIP: Examining the Hex Dump for troubleshooting issues relating to LDAP, FTP, and other unencrypted traffic flows can be an excellent way to spot configuration and user errors.

Exporting Packet Monitor Results
At times it's useful to export the results of a Packet Monitor for examination in another format or via another program. This can be accomplished through the Export As an option on the Packet Monitor page. Options include.
- Libpcap (Wireshark)
- Text (.wri)
- HTML
- App Data
- PcapNG (Firmware Versions 6.2.7.1 and Above)
Different Supported Packet Types on SonicOS are:
When specifying the Ethernet or IP packet types that you want to monitor or display, you can use either the standard acronym for the type if supported or the corresponding hexadecimal representation. The protocol acronyms that SonicOS currently supports are mentioned below:
| Supported Types | Protocol Acronyms |
| Supported Ethernet Types | ARP, IP, PPPoE-DIS, PPPoE-SES |
| Supported IP Types | TCP, UDP, ICMP, IGMP, GRE, AH, ES P |
 NOTE: When there is a need to specify both PPPoE-DIS and PPPoE-SES, you can simply use PPPoE.
Details on IP address and Port Information while configuring the packet capture
Source IP / Destination IP Address
- Specify the IP address (or addresses separated by commas) on which packet capture needs to be performed. A maximum of 10 IP addresses can be listed. Negative IP addresses are also supported like !1.1.1.1,!2.2.2.2/24 which is generally to exclude the traffic from that specified IP address. We can also include 1.1.1.0/24 syntax but it might not give the desired output.
Source Port/ Destination Port List
- Specify the Port Address (or addresses separated by commas) on which packet capture needs to be performed. A maximum of 10 UDP/TCP port numbers can be listed. Negative port numbers can also be specified like !80, !90, etc. which is generally to exclude the traffic for those ports.