How to switch the graphical view in Live Monitor on NSM
Description
This article gives information about how to switch the graphical view on Live Monitor to see how firewall added on NSM is behaving in real time.
Resolution
Follow the steps as mentioned below to switch graphical view on the Live Monitor:
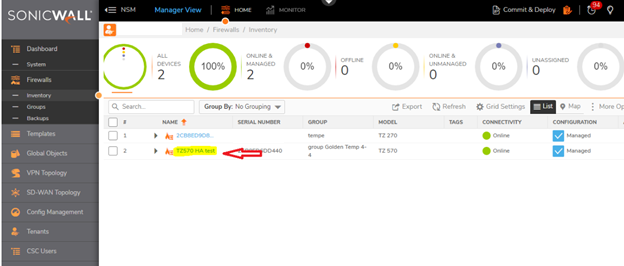
- Log into NSM management page, Navigate to Firewall > Inventory and click the firewall name added under the tenant as shown below.

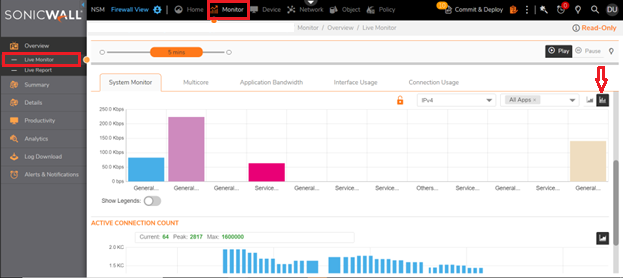
- Select monitor on the top of the dashboard Click on Overview and select Live Monitor on left side of the dashboard as mentioned below.

- After selecting Live Monitor page, define the type of monitor such as System Monitor, MultiCore, Application Bandwidth, Interface Usage, Connection Usage to display in graphical format.
- Using the orange slider bar to set the interval for the report. The predefined intervals range from 60 secs to 10 mins.
In this example, we are selecting System Monitor under Monitor > Live Monitor. You can filter the information on the System Monitor and the Interface Usage tabs according to the IP version by selecting from IPv4, IPv6 or Both.

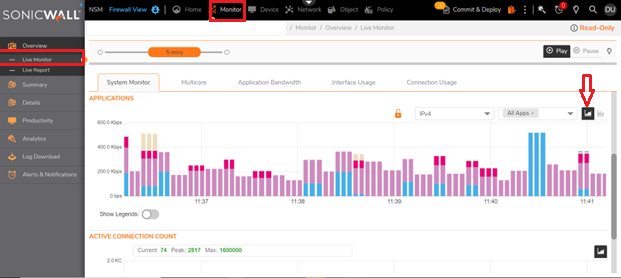
Using the icons to the right side, you can change the graphical view between a bar chart and a line graph by clicking on icon.

Now System Monitor details will display data in line graph format. Enable Show Legends to display the fields in line graph on live monitor.
Related Articles
not finding your answers?